Introduction
When drivers break the regulations that govern vehicle operation on streets and highways, they commit a traffic violation. These kind of infractions are extremely widespread. Local police frequently issue traffic infractions, which are then handled by local sections of state courts. Is there, however, a certain racial or age group to whom the police give these offences more frequently? Is there any prejudice in who gets the violations? This study’s analysis will provide answers to all of these queries.

Graphical Analysis
Different Types of Violations
There are several forms of offences that might result in a police stop. Speeding, moving violations (Reckless Driving, Hit and Run, Assaulting another driver, pedestrian, improper turns and lane changes), Equipment (Window tint violations, Headlight/taillights out, Loud exhaust, Cracked windshield), Registration/Plates, and Seat Belt, are the most common types of violations. The following is a graph visualizing the most common types of violations.
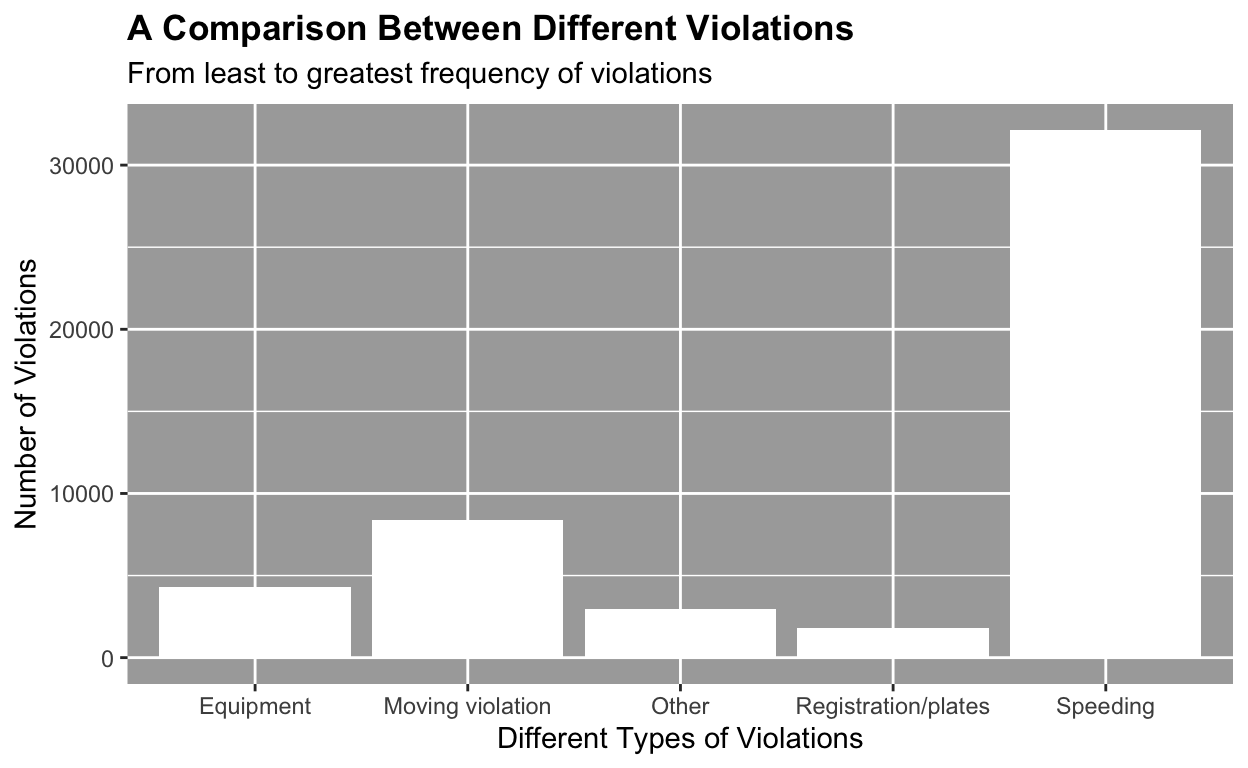
As depicted in the graph above, speeding is the most common violation by majority. The second most common violation is the moving violation. The least common traffic violation is a violation related to registration and plates.
At What Age Are The Violations Most Common
The violations shown above can occur to anyone at anytime. However, there are certain aspects that play a role into which groups are more common to face violations. For instance less experienced drivers tend to face more mistakes on the road than someone who has much experience. Therefore, we will be analyzing the affects of age groups to the chance of facing a violation. The following graph is a visualization of the number of violations per age.
The x-axis in the graph above ranges from 16 (the youngest age to obtain a driver’s licence) to roughly 88 years of age. The age with the most infractions is around 21 years old, with approximately 2400 violations. It is also clear that the number of violations climbs exponentially from 16 to the peak of the graph at 21 years of age. This illustrates how young drivers with little experience are more likely to get penalised. The reason for this is that young drivers are more prone than older drivers to underestimate or fail to detect potentially hazardous conditions. Young drivers are also more likely than adults to make important decision errors, which can result in serious violations. As a result, the cost of automobile insurance is higher for younger drivers.
What Race Faces More Violations
As previously stated, several factors influence who is subjected to these infractions. However, before reaching any conclusions, a date analysis is necessary. As a result, I’ll be evaluating the violations by race in this dataset to determine if one race has more violations than another. However, the findings may not be as predicted because the dataset may be based on a location of a certain race with higher populations, skewing the graph.
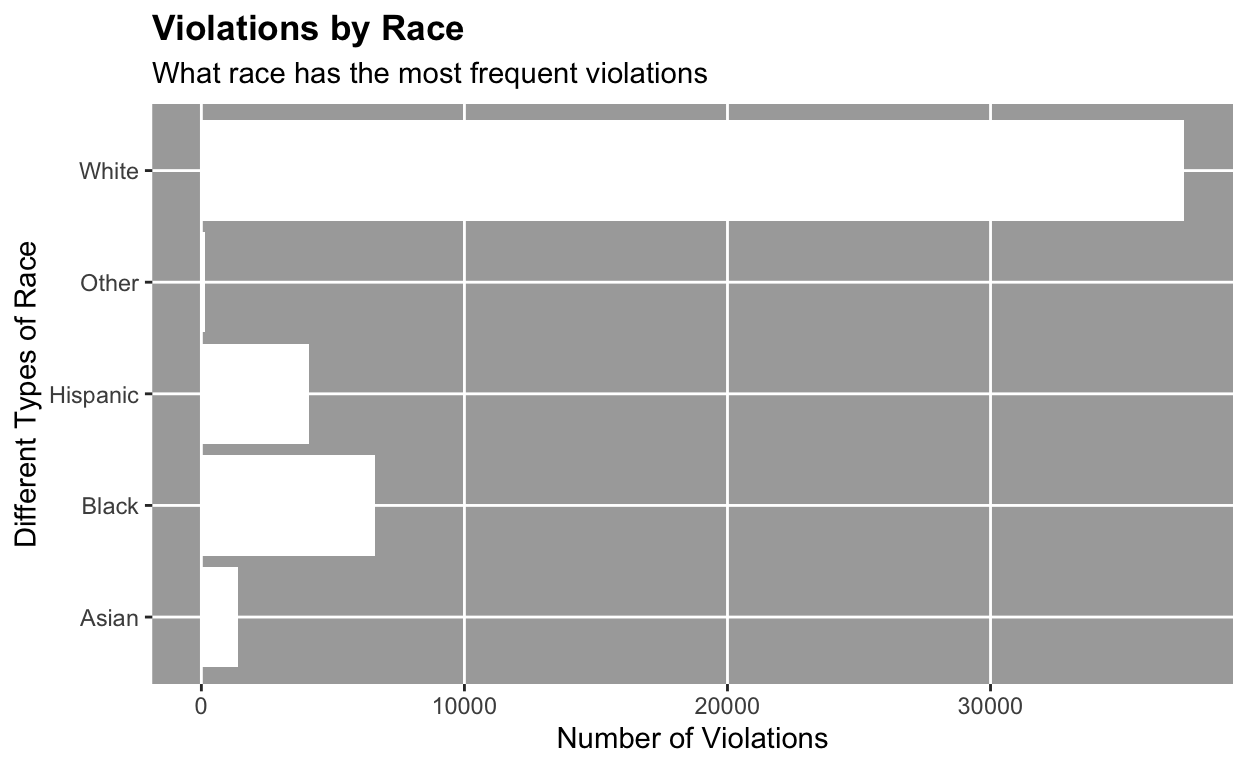
As indicated in the graph, the white race has the most infractions, accounting for around 71% of all violations. It is also clear that around 12% of the violations are committed by the black race, with the remaining 17% committed by people of other races such as Hispanic, Asian, and etc. As previously noted, this has little value because the location where this data was collected may have a concentrated white population, which completely affects the results. As a result, while the white race is revealed to have the highest number of infractions, this does not imply anything specific.
Conclusion
We can draw certain inferences from the analysis of traffic violations. It is evident that the most significant and often occurring violation on the roadways is speeding. Speeding infractions were clearly revealed to be the most common in the sample in graph 1. Second, it is clear from graph 2 that the age with the most infractions is 21 years old. The graph also showed that teenage drivers were more likely to commit these offences than older and more experienced drivers. Finally, graph 3 demonstrates that the white race is implicated in the biggest number of violations in the dataset, but this is not significant because the dataset may have come from a densely white inhabited place.